
Cluster & Cloud Computing - Gluttony Tweets Analyzer
To verify a story with AURIN, we extracted tweets related to gluttony by searching for certain keywords in the text and correlated the number of tweets on gluttony in certain areas of Melbourne with total number of people having health issues. We were able to verify that the number of tweets classified were proportional to the number of people having health issues in those area.
Project Link: https://github.com/abhinavcreed13/GluttonyTweetsAnalyzer
Prerequisities
- Ansible
- Linux Terminal
- Openstack cloud (Nectar)
Visualizations
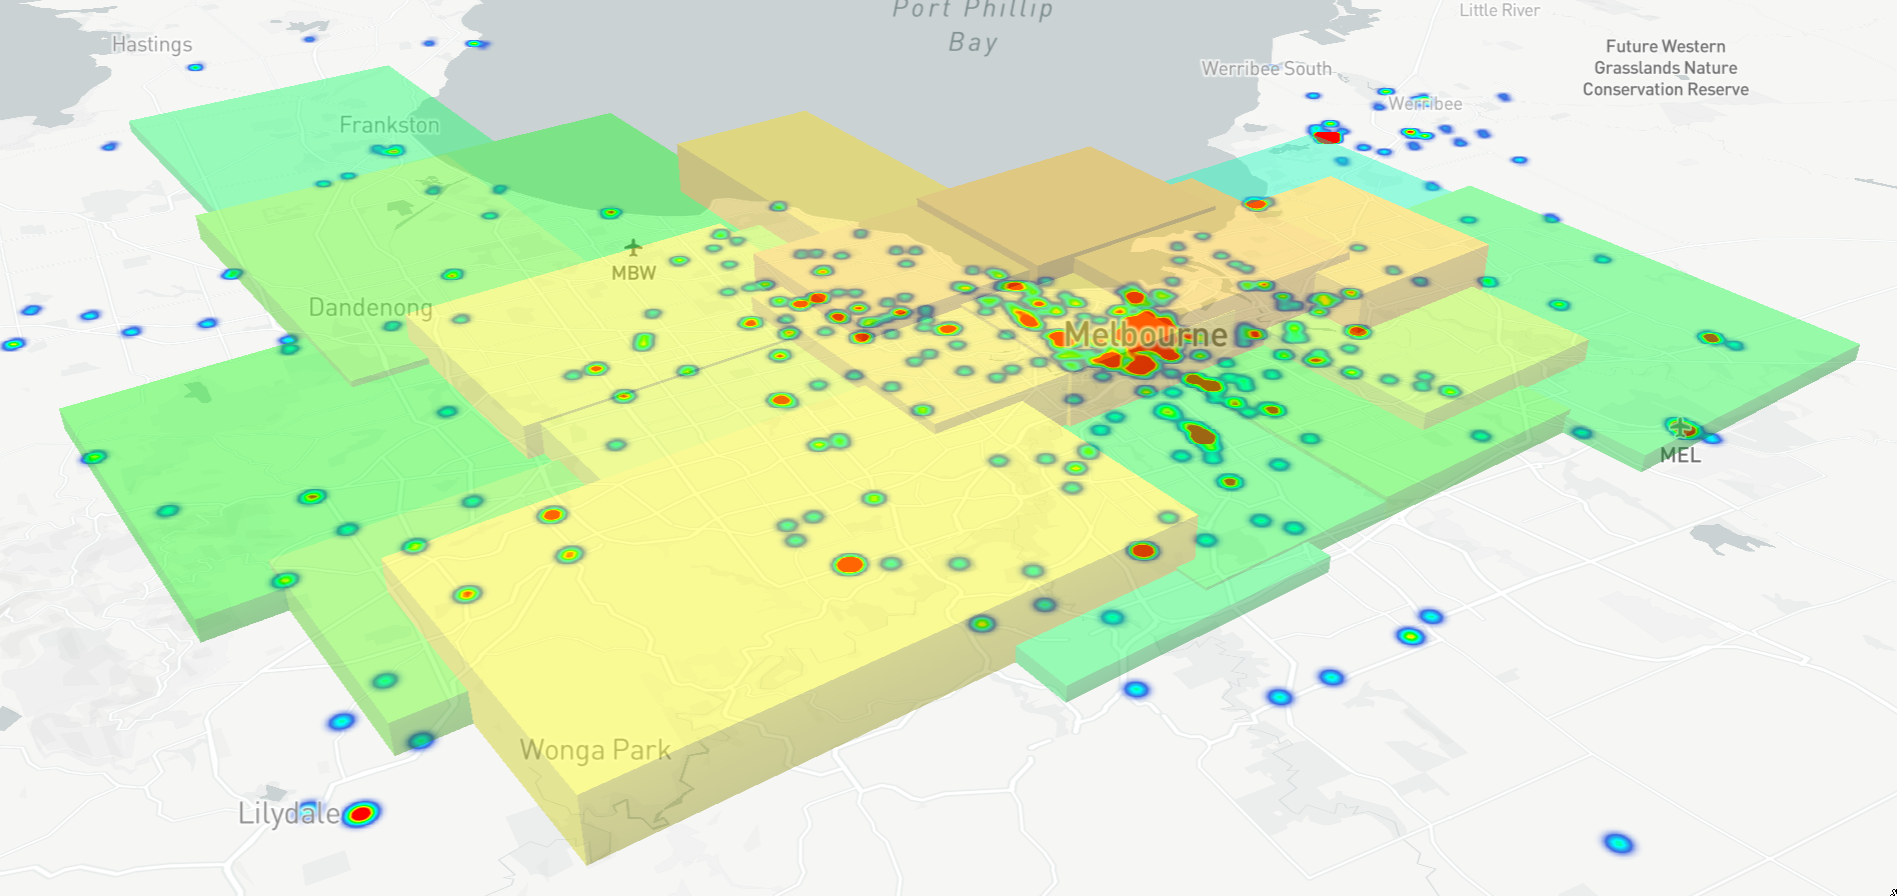
Data is displayed on a map using mapbox-gl-js, which allows for easy consumption of GeoJSON data, as well as highly customisable styling and complex data visualisation due to the use of vector data and arbitrary WebGL layers. The map uses a light, low contrast style Mapbox Light which provides a simple, distraction-free background on which to display data, allowing the data visualisation to be the standout element.
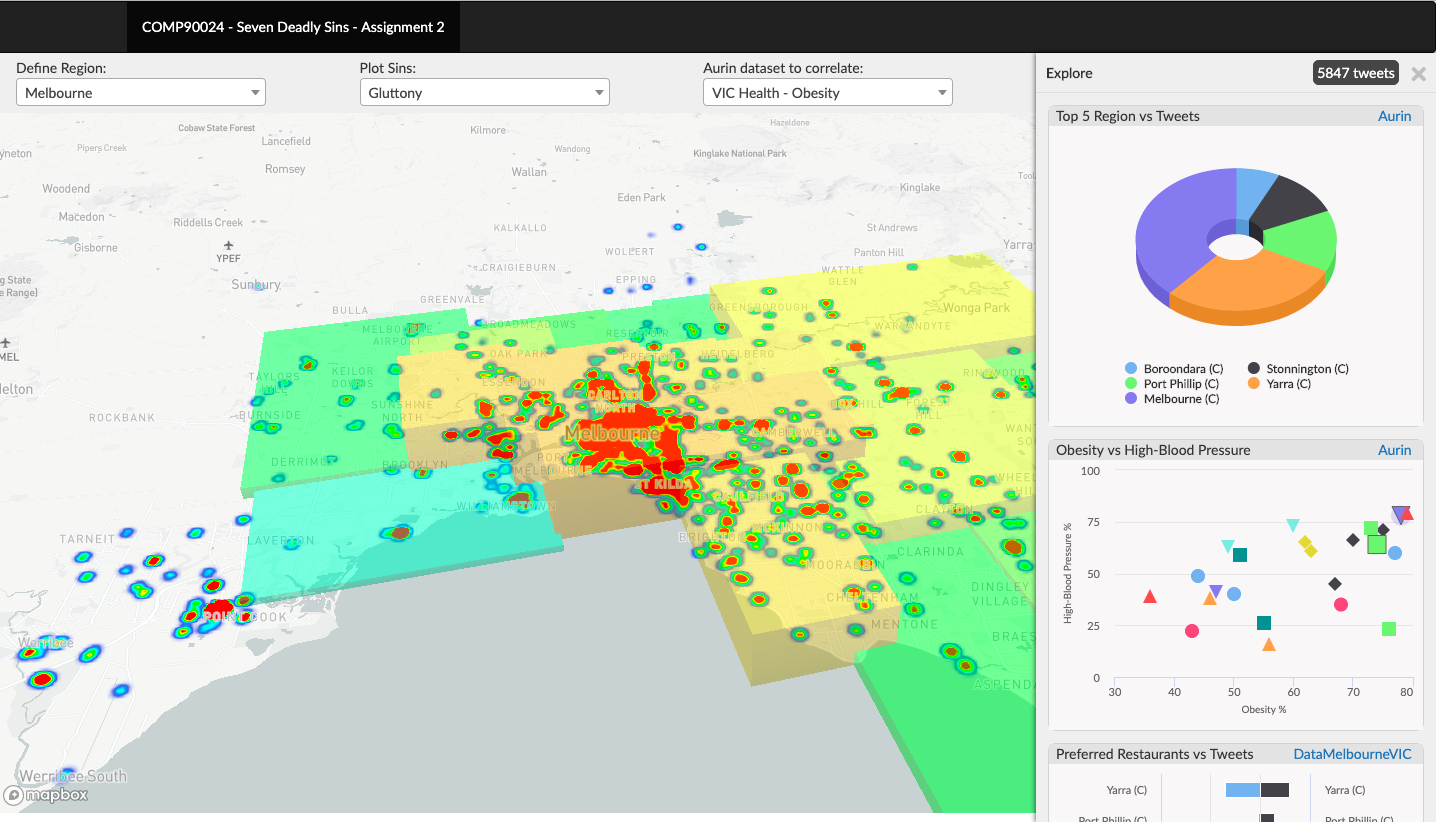
Exploring feature helps in providing in-depth analysis of the story using various visualizations. After tweets are plot on the map and corresponding data correlation set of AURIN is selected, user can use explore module to get more analysis from the data which is plotted on the map as shown in below figure.
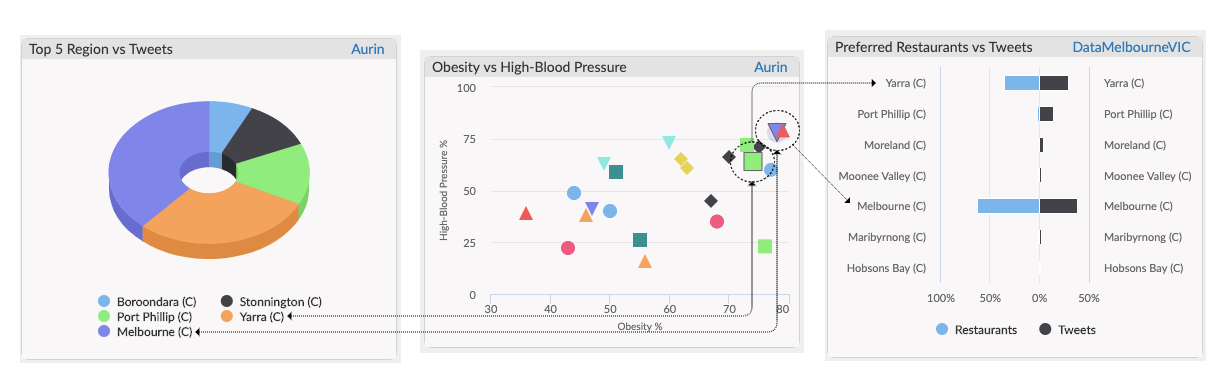
As shown in the below figure, Melbourne and Yarra are the regions where most of the gluttony tweets are found by the harvester using its analysis engine. Comparing this information with scatter plot, it is also noticed that these regions indeed have high patients of obesity and blood-pressure. Moreover, the assumption that these regions will then have higher number of preferred restaurants is also seen by using some other data source from DataMelbourneVic. Hence, exploration of data with these visualization helped us to define a strong hypothesis for extracted gluttony tweets.
Useful Links
-
Youtube Video Link: https://youtu.be/uUYbnlUWf6A
-
Overleaf LaTeX Project Link: https://www.overleaf.com/read/wgdhystbbygt
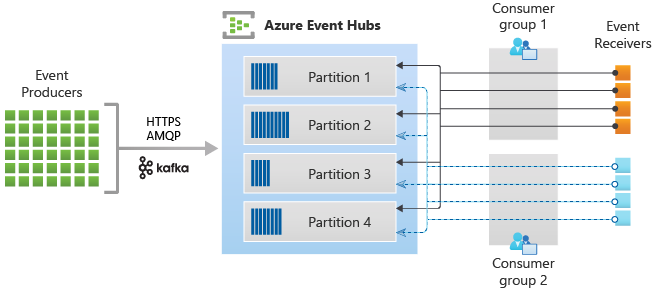
System Architecture
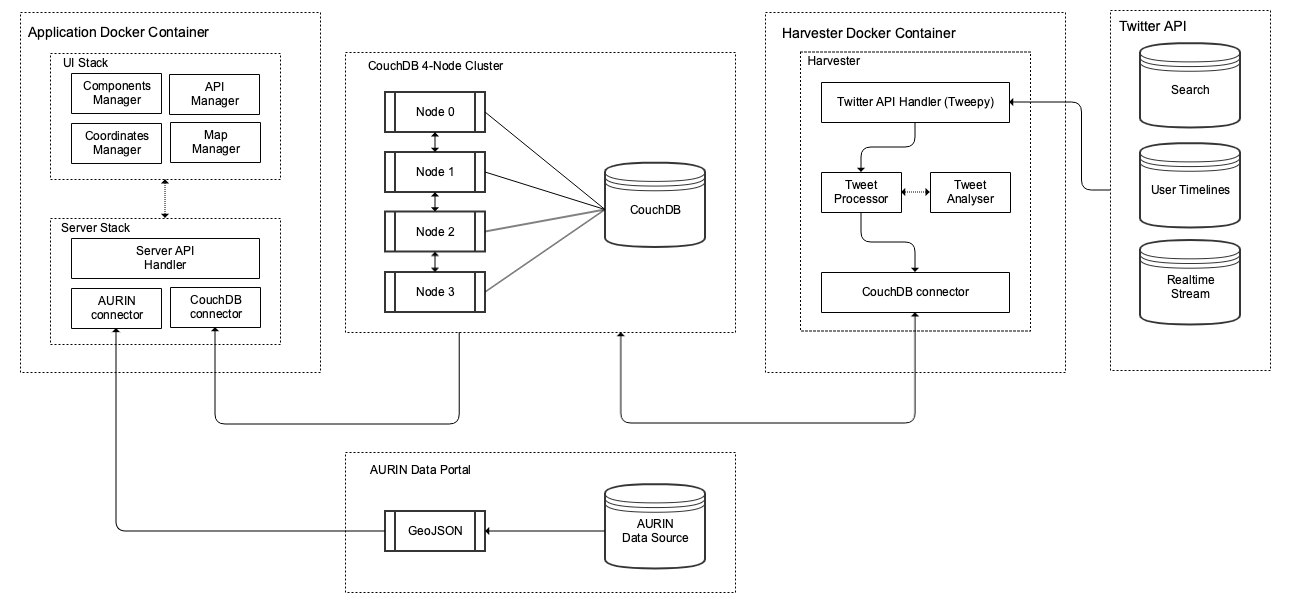
Our system architecture is designed with a thought-process of leveraging the power of containerization and using CouchDB with AURIN in the most efficient manner. The core components of the architecture are Application and Harvester, which are built into docker images and ran in their individual docker containers as shown in below figure.
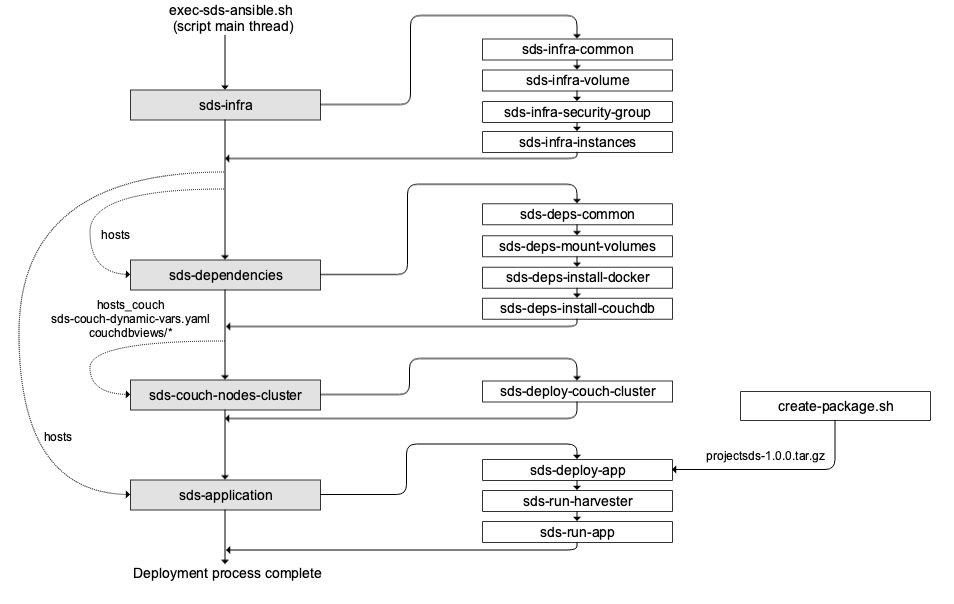
Deployment Flow
Our aim is to deploy our entire application with its dependencies and infrastructure using single executable script. This process of deploying using single executable script is shown in below figure.
User Guide
This guide provides information on how developer can deploy our system and how users can interact with the system to view and play around with the story.
Installation Guide
We have created installation module of this system with the goal of deploying entire
application with its infrastructure using single executable script. This project already
has the .tar.gz package created using create-package.sh due to which entire system
on the cloud can be deployed using following steps:
- Install Ansible in the system using which cloud deployment will be performed.
- Download
openrc.shfile from dashboard of NeCTAR Research Cloud. It is also recommended to generate API password by resetting it and saving it somewhere as it will be prompted to enter by the script frequently. - Create key-pair on the NeCTAR cloud by uploading public key generated using local machine.
- Rename your private key to
cloud.keyand copy it withopenrc.shinsideProjectSDS/deployment/sds-ansible/static/serverfiles. - Open terminal at
ProjectSDS/deployment/sds-ansiblelocation and trigger following command to start deployment:sh exec-sds-ansible.sh - The installation will ask for SUDO password and will prompt frequently to enter openstack API password. After entire flow is completed, application and harvester should be up and running.
User-Interface Guide
This guide explains the UI capability and features provided by the system by user can perform several operations and visualize our scenarios.
• Defining Regions. User has the ability to filter desired region based on the area on which visualization is required. Depending upon the region selected, map automatically select the desired region.
• Selecting tweets filter. UI provides the capability of selected filter on the tweets based on the kind of correlation user want to see for sins with AURIN dataset.
• Selecting AURIN dataset. User can selected desired AURIN dataset for visualizing correlation on the map with respect to the filter provided on the tweets.
• Maps manipulations. Maps can be easily manipulated by using basic mouse operations. It also provides the capability of visualizing AURIN dataset in heatmaps with data interaction capabilities as explained in the report.
• Exploring correlation. UI also provides the capability of exploring correlation with more in-depth analysis using visualizations. Using explore feature, user can see how tweets of respective filter are relating with the selected AURIN dataset in much more detailed mannner as explained in the report.
The Final Story
We went through about 10 thousand tweets to understand the most frequent words in the corpus. Interestingly, we saw that there were a large number of tweets that revolved around keywords: ‘food’, ‘drink’, ‘cafe’, ‘restaurant’, etc. These tweets predominantly revolved around gluttony. We also came across a dataset in Local Government Area (LGA) profiles data for VIC. This dataset contained the percentage of people having diabetes, high blood pressure, obesity and heart diseases in certain parts of victoria. Since, most of the tweets were being harvested from Melbourne, we targeted only Melbourne. While extracting tweets on gluttony based on the above keywords, we were able to get decent correlation between the ratio of tweets and the people having such diseases.
After completing our correlation, we were also presented with the ontology from Universidad Complutense de Madrid. However, due to limitation in time for submission, we haven’t been able to explore our previous story line using the ontology. We plan to use the ontology to complete our analysis in due time.
As we had many tries and a lot of code, we decided to merge only the used code. Not used parts can be found in branches knezi-analyse and kabir-branch.
Leave a comment